

Autonomous Trading
A GREY CREEK INTERFACE STUDY / 01
 GREY
CREEK
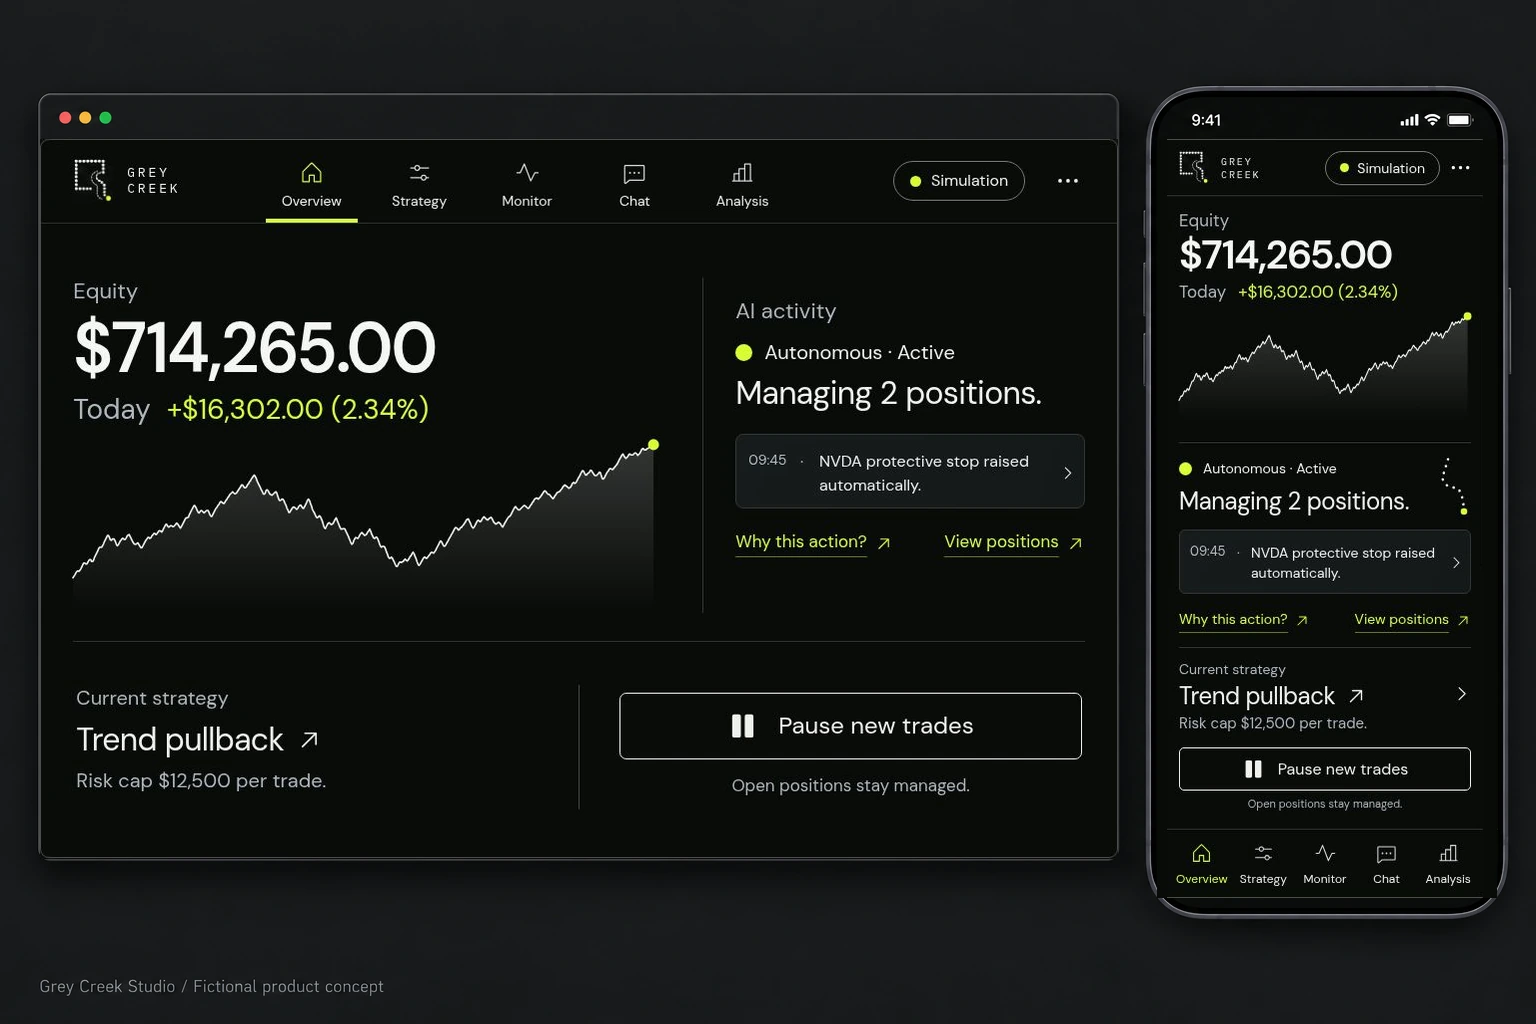
Equity
$714,265.00
Today +$16,302.00 (2.34%)
AI activity
Autonomous · Active
Managing 2 positions.
Open positions stay managed.
Today+$16,302.00 (+2.34%)
FICTIONAL PERFORMANCE
October 2026
17 sample sessions · through 23 Oct 2026
Calculated from this month’s closed-trade ledger
+$14,265.00 (+2.04%) this month
Month breakdown 78 closed trades
- Net P/L · USD
- +$14,265.00
- +2.04% return after fees
- Gross P/L
- +$14,421.00
- Before illustrative fees
- Total fees
- $156.00
- $1.00 per entry / exit fill
- Closed round trips
- 78156 fills
- 47 long · 31 short
- Long47 closed round trips · 94 fills
- +$33,104.00net after fees
- Short31 closed round trips · 62 fills
- −$18,839.00net after fees
Illustrative flat fee: $1.00 per fill, $2.00 per completed round trip. Net P/L = gross P/L − entry fee − exit fee. Borrow costs, slippage and taxes are excluded.
P/L calendar
NET · USDCells show rounded net USD (k = thousands). Select a sampled day for exact cents. Weekends and dates after 23 Oct have no session.
SELECTED SESSION
23 Oct 2026
Day breakdown
- Gross P/L
- +$16,314.00
- Total fees
- $12.00
- Closed round trips
- 612 fills
- Direction
- 3 long / 3 short
Selected in Monitor and Trades.
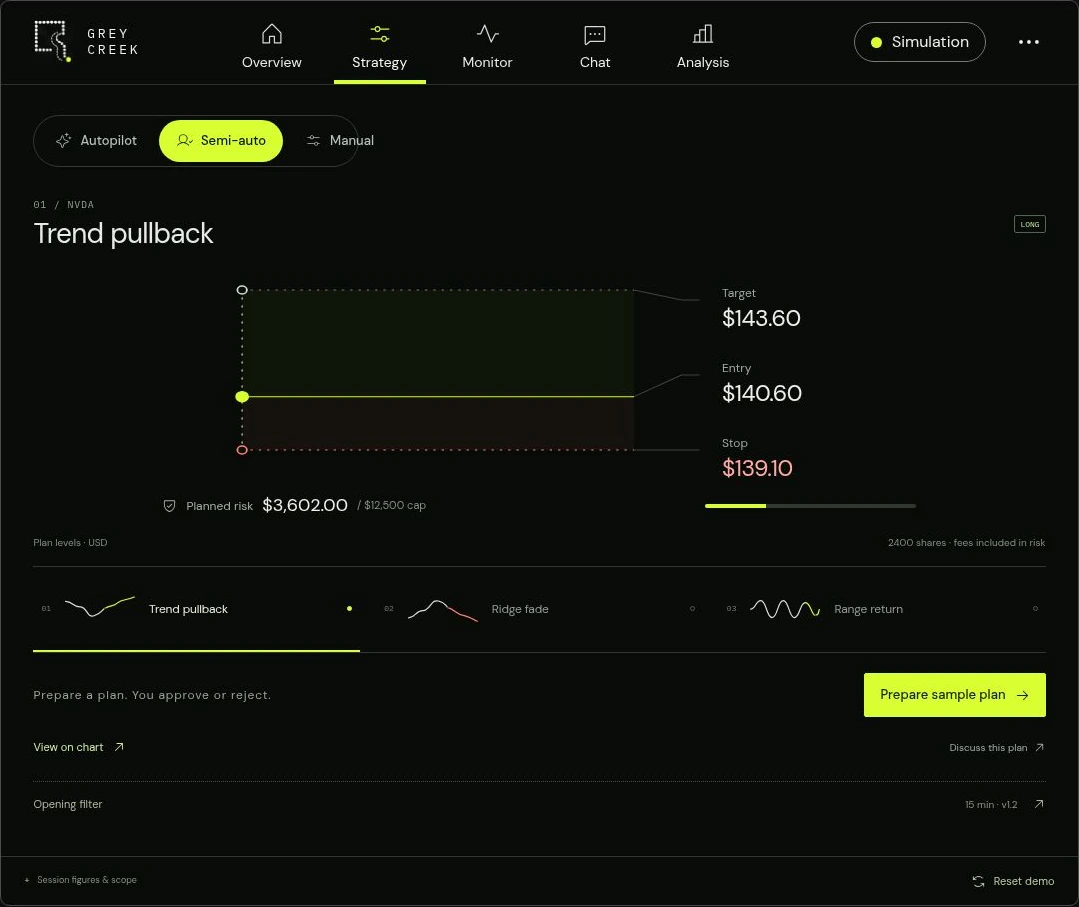
Strategy plan sandbox
Trend pullback
Semi-auto. Choose a strategy and prepare a fictional plan.
Opening filter 15 min · v1.2
Historical rule preview. The sample ledger stays fixed.
How replies work
Keywords are checked in this order: opening / filter / rule / strategy; mode / compare; plan / prepare / build / setup; session / explain / ledger / fees / trades / P/L. Unmatched requests show the supported options. Nothing is sent.
THE INTERFACE / DESKTOP + MOBILE
A clear view of AI at work.
A fictional $700k portfolio.
About this demo
Overview illustrates a two-position portfolio snapshot. Monitor and Analysis use a separate dated historical sample. All figures are illustrative. Fictional prices, prewritten setups and preset exits. The plan sandbox demonstrates Autopilot, Semi-auto and Manual review flows without creating orders. Replay reveals the historical sample minute by minute; plan and strategy changes do not recalculate its ledger. This browser-local demo resets on reload. No AI service, market feed or broker is connected. Candle structure references SPY five-minute sample characteristics from FirstRate Data; the displayed NVDA prices and trades remain fictional.
YOUR NEXT INTERFACE
Make complex ideas
feel considered.
Explore a product concept, a clearer information structure, or a visual direction across desktop and mobile.
This study is a design reference. Project scope, timing and quote are agreed together.